:


tar xvfz example.tar.gz model.ctl (A GrADS descriptor file)
model.dat (A GrADS binary data file)
tutorial (A text file containing the contents of this tutorial)
This example data set is a a binary data file containing sample model output (model.dat) and data descriptor file (model.ctl), a text file that contains the necessary metadata that GrADS needs. The data descriptor file describes the structure of the data file, which in the case contains 5 days of global grids that are 72 x 46 elements in size. The text of the sample session below is also included for your convenience.
To start up GrADS, enter:
grads If the grads executable is not in your current directory, or if it is not in your PATH somewhere, you may need to enter the full pathname, ie:
/usr/homes/smith/grads GrADS will prompt you with a landscape vs. portrait question; just press enter. At this point a graphics output window should open on your console. You may wish to move or resiae this window. Keep in mind that you will be entering GrADS commands from the window where you first started GrADS -- this window will need to be made the 'active' window and you will not want to entirely cover that window with the graphics output window.
In the text window (where you started grads from), you should now
see a prompt: ga-> You will enter GrADS commands at this
prompt and see the results displayed in the graphics output
window.
The first command you will enter is:
open model.ctlYou may want to see what is in this file, so enter:
query file
One of the available variable is called ps, for surface pressure.
We can display this variable by entering:
d psd is short for display. You
will note that by default, GrADS
will display a lat/lon plot at the first time and at the lowest
level in the data set.
Now you will enter commands to alter the dimension environment.
The display command (and
implicitly, the access,
operation, and
output of the data) will do things with respect to the current
dimension environment. You control the dimension environment
with the set command:
clear
clears the displayset lon -90
sets longitude to 90 degrees Westset lat 40
sets latitude to 40 degrees Northset lev 500
sets level to 500 mbset t 1
sets time to first time stepd hgt displays the variable called 'hgt'GrADS will not draw anything to the display window, but instead prints out "Result value = 5447.17" to the command window.
In the above sequence of commands, we have set all four GrADS dimensions to a single value. When we set a dimension to a single value, we say that dimension is "fixed". Since all the dimensions are fixed, when we display a variable we get a single value, in this case the value of 'hgt' at the location 90W, 40N, 500mb, at the 1st time in the data set.
If we now enter:
set lon -180 0 X is now a varying
dimensiond hgt
We have set the X dimension, or longitude, to vary. We have done this by entering two values on the set command. We now have one varying dimension (the other dimensions are still fixed), and when we display a variable we get a line graph, in this case a graph of 500mb Heights at 40N.
Now enter:
clear

 set lat 0 90

d hgt
We now have two varying dimensions, so by default we get a contour plot. If we have 3 varying dimensions:
c

 set t 1 5

d hgt
we get an animation sequence, in this case through time. For some modern computers, the display of all 5 time steps may be so fast that the animation may not be evident.
Next enter:
clear

 set lon -90

set lat -90 90

 set lev 1000 100

set t 1

 d tair

 d u
In this case we have set the Y (latitude) and Z (level)
dimensions to vary, so we get a vertical cross section. We have
also displayed two variables, which simply overlay each other.
You may display as many items as you desire overlaid before you
enter the clear command.
Another example, in this case with X and T varying (Hovmoller
plot):
c

 set lon -180 0

 set lat 40

 set lev 500

 set t 1 5

d hgt
<
Now that you know how to select the portion of the data set to
view, we will move on to the topic of operations on the data.
First, set the dimension environment to an Z, Y varying one:
clear

 set lon -180 0

 set lat 0 90

 set lev 500

set t 1
Now say that we want to see the temperature in Fahrenheit instead of Kelvin. We can do the conversion by entering:
display (tsfc-273.16)*9/5+32Any expression may be entered that involves the standard operators of +, -, *, and /, and which involves operands which may be constants, variables, or functions. An example involving functions:
clear

d sqrt(u*u+v*v)
to calculate the magnitude of the wind. A function is provided to do this calculation directly:
d mag(u,v)
Another built in function is the averaging function:
clear

d ave(hgt,t=1,t=5)
In this case we calculate the 5 day mean. We can also remove the mean from the current field:
d hgt - ave(hgt,t=1,t=5)We can also take means over longitude to remove the zonal mean:
clear

d hgt-ave(hgt,x=1,x=72)

d hgt
We can also perform time differencing:
clear

d hgt(t=2) - hgt(t=1)
This computes the change between the two fields over 1 day. We could have also done this calculation using an offset from the current time:
d hgt(t+1) - hgtThe complete specification of a variable name is:
name.file(dim +|-|= value, ...)If we had two files open, perhaps one with model output, the other with analyses, we could take the difference between the two fields by entering:
display hgt.2 - hgt.1Another built in function calculates horizontal relative vorticity via finite differencing:
clear

d hcurl(u,v)
Yet another function takes a mass weighted vertical integral:
clear

d
vint(ps,q,275)
Here we have calculated precipitable water in mm.
Now we will move on to the topic of controlling the graphics output. So far, we have allowed GrADS to chose a default contour interval. We can override this by:
clear

set cint 30

d hgt
We can also control the contour color by:
clear


set ccolor 3

d hgt
We can select alternate ways of displaying the data:
clear

set gxout shaded

d
hcurl(u,v)
This is not very smooth; we can apply a cubic smoother by entering:
clear

set csmooth on

d
hcurl(u,v)
We can overlay different graphics types:
set gxout contour

set ccolor 0

set cint 30

d hgt
and we can annotate:
draw title 500mb Heights and
Vorticity
We can view wind vectors:
clear

set gxout vector

d u;v
Here we are displaying two expressions, the first for the U
component of the vector; the 2nd the V component of the vector.
We can also colorize the vectors by specifying a 3rd field:
d u;v;qor maybe:
d u;v;hcurl(u,v)You may display pseudo vectors by displaying any field you want:
clear

d mag(u,v) ;
q*10000
Here the U component is the wind speed; the V component is moisture.
We can also view streamlines (and colorize them):
clear

set gxout stream

d u;v;hcurl(u,v)
Or we can display actual grid point values:
clear

set gxout grid

d u
We may wish to alter the map background:
clear

set lon -110 -70

set lat 30 45

set mpdset mres

set digsize 0.2

set dignum 2

d u
To alter the projection:
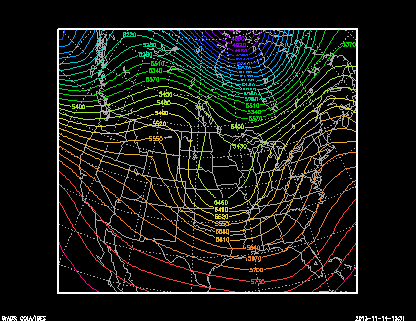
set lon -150 -40

set lat 15 80

set mpvals -120 -75 25 65

set mproj nps

set gxout contour

set cint 30

d hgt
In this case, we have told grads to access and operate on data from longitude 145W to 40W, and latitude 15N to 80N. But we have told it to display a polar stereographic plot that contains the region bounded by 120W to 75W and 25N to 65N. The extra plotting area is clipped by the map projection routine.
This concludes the sample session. At this point, you may wish
to examine the data set further, or you may want to go through
the GrADS documentation and try out the other options described
there.