2. Inter-Comparison |
| Comparison of LSPs | Implications for Model Development |
Table 2. Simulated 2 years (1987-1988) global mean land surface water and energy balance. Units are mm y-1 for the moisture terms, W m-2 for energy, dimensionless for the Bowen Ratio.
| Group | Precip. | Evap. | Runoff | Net radiation | Sensible heat | Latent heat | Bowen ratio |
| JMA | 740.3 | 496.14 | 242.66 | 79.7 | 38.97 | 39.59 | 0.98 |
| NCEP | 740.79 | 515.99 | 223.04 | 82.85 | 42.29 | 40.85 | 1.04 |
| CSU | 740.29 | 482.19 | 254.86 | 83.60 | 44.1 | 38.48 | 1.15 |
| GSFC/Hydro | 740.65 | 517.88 | 221.39 | 86.76 | 45.69 | 40.32 | 1.13 |
| GSFC/Meso | 740.13 | 608.74 | 142.07 | 83.44 | 35.2 | 47.43 | 0.74 |
| GSFC/Clim | 740.63 | 474.11 | 265.26 | 79.41 | 39.41 | 37.51 | 1.05 |
| COLA | 740.21 | 445.53 | 292.73 | 79.56 | 43.47 | 34.55 | 1.26 |
| U.Arizona | 740.31 | 493.49 | 244.19 | 67.84 | 28.39 | 39.38 | 0.72 |
| Meteo France | 740.3 | 535.85 | 202.18 | 81.70 | 39.73 | 42.51 | 0.93 |
| Macquarie U. | 740.31 | 556.91 | 200.45 | 73.70 | 30.15 | 44.16 | 0.68 |
| CCSR/NIES | 740.31 | 525.09 | 224.85 | 76.31 | 35.06 | 40.68 | 0.86 |
The ICC performed a number of comparisons
of the model simulations. These include checks and comparisons of the water
and energy balances on both the global scale and over selected large river
basins. Table 2 shows the comparison of the two-year mean global balance
of water and energy for each model. Precipitation and downward radiation
were specified forcings that should be the same for each model, although
there appear to be some small variations in these terms on the order 0.1%
or less. The COLA version of SSiB produced the largest global Bowen ratio
of all the models at 1.26; the BASE model from Macquarie University produced
the smallest ratio: 0.68. The mean Bowen ratio of all the models is just
below unity. This partitioning is reflected in the distribution of precipitation
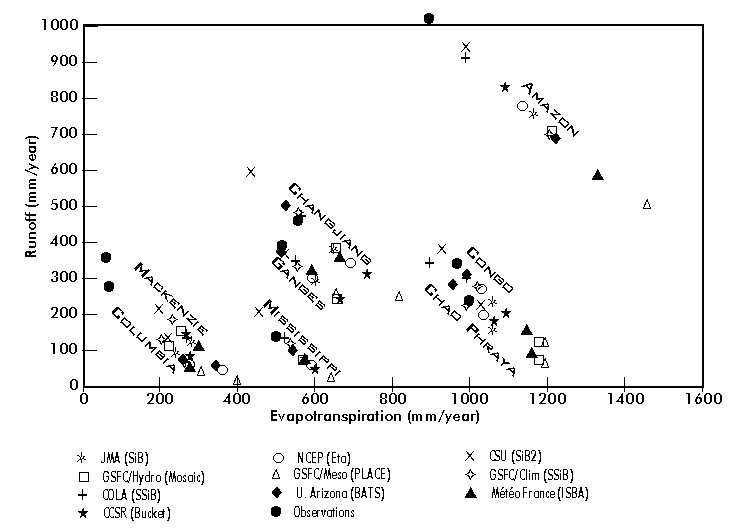
between runoff (both surface and baseflow) and evapotranspiration. The
spread among models in their partitioning of the surface water balance
between runoff and evapotranspiration in several large river basins is
illustrated in Figure 2. In the majority of cases, the models under-forecast
runoff. The observed evapotranspiration is derived from observed precipitation
and streamflow, assuming no net change in storage during the two year period.
Most of the models behave consistently between the basins, with the same
models routinely appearing at either end of the distribution. The models
as a whole particularly under-forecast runoff over the colder basins where
snow is a major component of the precipitation.
One of the advantages of participation in GSWP, which many in the Production Group have discovered, is that once their LSPs have been set up with the proper framework to perform the two-year integration for the project, they have created an excellent testbed for model development. There are several prominent examples in this pilot phase.
Douville et al. (1999) found that they could improve the simulated basin-scale runoff in the ISBA LSP by implementing several changes. They found that by improving upon the treatment of convective precipitation as specified in the GSWP guidelines, and by employing the runoff scheme of Dümenil and Todini (1992), they were able to increase runoff, which was generally underestimated in the control simulation.
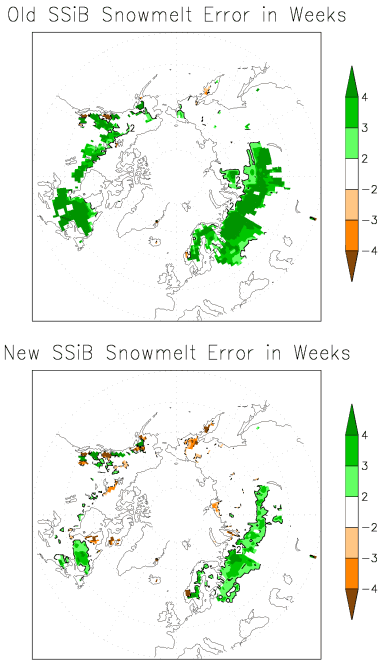
Sud and Mocko (1999) describe the development of an improved parameterization of snow that was inspired by the poor performance of their version of SSiB in the GSWP validation over the wheat belt of Russia and over Canada. The new snow scheme employs a separate snow layer with its own thermodynamic treatment and radiative properties. They found a significant improvement in the timing of the spring snowmelt (Figure 3), in the partitioning of the meltwater between infiltration and surface runoff, and more realistic shallow soil temperatures.
Boone and Wetzel (1999) find evidence that the use of aggregated soil hydraulic parameters at 1×1 resolution may lead to significant underestimation of runoff, and overestimation of evapotranspiration. The highly non-linear dependence of the fluxes of heat and moisture within the soil on conductivity and matric potential lead to considerable differences between explicitly heterogeneous and aggregated treatments of the soil properties. Their results suggest that heterogeneity can be difficult to account for in single-column treatments of the soil.
Pitman et al. (1999) found, during sensitivity experiments to examine the role that the specification of leaf area index (LAI) may have on simulation of the surface energy and water balance, that the difference between the use of the 1×1 monthly data set of LAI from ISLSCP Initiative I and a simpler specification where LAI is simply a function of vegetation type and month was well within the range of uncertainty for the global LAI data set. Thus, they conclude that the simpler approach, historically used by many land surface schemes but gradually being abandoned, is still justifiable. The implication in this case is that an element of model development which many are now undertaking, namely the inclusion of LAI information derived from high-resolution satellite data, may not currently be beneficial.
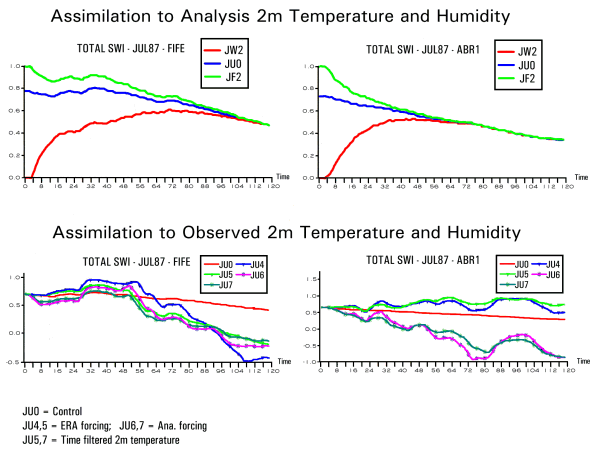
Douville et al. (1999) proposed a land data
assimilation system, based on an optimal interpolation technique using
errors in the predicted near-surface temperature and relative humidity
(Mahfouf 1991), to produce a soil moisture analysis. This technique
has been recently implemented in the operational weather forecast system
at Météo-France (Giard and Bazile 1998) and validated against
the First ISLSCP Field Experiment (FIFE; Sellers et al. 1992) data set
in the ECMWF single column model (Douville et al. 1998). In order
to implement the method in the framework of GSWP, it is necessary to compare
the predicted 2 m parameters with 2 m observations, and therefore to replace
the ISLSCP screen-level meteorological forcing by the forcing at the lowest
level of the ECMWF model from either the reanalysis (Gibson et al. 1994;
experiments JU0, JW2, JF2, JU4 and JU5) or the operational analysis (JU6
and JU7). Under ideal conditions, i.e. using pseudo-observations
produced at each model grid point by a reference 31-day (July 1987) ISBA
simulation, reintegration of the GSWP experiment with perturbed initial
soil wetness (wilting point for JW2, field capacity for JF2) shows the
land data assimilation technique to converge to the soil wetness of the
control case within a few weeks, as illustrated for selected grid points
close to the sites of the FIFE and ABRACOS (Anglo-Brazilian Amazonian Climate
Observation Study; Gash and Nobre 1997) field campaigns (Figure 3). Using
real SYNOP observations and unperturbed initial soil wetness, the analyzed
soil moisture is different from the reference forecast (bottom of Fig 3)
and can be quite sensitive to the choice of the meteorological forcing
(ECMWF reanalysis or analysis). Using a high pass filter of the 2
m temperature errors in experiments JU5 and JU7, the spurious effect of
systematic biases in the meteorological forcing is avoided, and therefore
sensitivity to the choice of the forcing is reduced. This is true for the
FIFE grid point, but the analysis remains very dependent on the ECMWF forcing
for the ABRACOS grid point. This result indicates the need for a
more accurate atmospheric forcing, or for implementing the data assimilation
with a free boundary layer in order to give more robustness to the results
and to be more confident in the resulting soil moisture analysis.